
Enhancing Sales Efficiency with the Price Explorers

Introduction
Hunter Douglas’s dealers were hindered by a manual, time-intensive process to compare products, configurations, and pricing on the field. Relying on cumbersome paper-based methods and spreadsheets, dealers struggled to quickly deliver accurate, real-time information to customers - hindering their ability to close deals effectively.
Recognizing this challenge, Hunter Douglas embarked on a mission to develop the Price Explorer, a cutting-edge, iPad-optimized tool designed to empower dealers with fast, intuitive product and price comparisons. The objective was clear: streamline the sales process, boost dealer confidence, and accelerate conversions through a user-friendly digital platform.
CLIENT

ROLE
User Research
UX Strategist
UX Designer
DURATION
9 Months
TEAM SIZE

7
The Challenge
Overcoming Field Friction to Empower Sales
Complex Product Configurations
Dealers faced a maze of sizes, materials, finishes, and pricing that made accurate comparisons nearly impossible.
Field Usability
Dealers required a highly responsive, touch-friendly tool that performed seamlessly on iPads under diverse field conditions.
User Adoptions.
Convincing dealers to shift from a manual process to a digital solution required a seamless, user-friendly experience that aligned with their real-world workflows.
Problem Statement
Hunter Douglas dealers faced inefficiencies and errors due to outdated, manual comparison methods. An intuitive, digital-first solution was critical to streamline operations, enhance real-time decision-making, and ultimately, boost sales performance.
The Bold Objectives
The Bold Objectives
Simplify the Sales Process:
Build an intuitive tool enabling dealers to effortlessly compare product options and configurations.
Increase Sales Conversions:
Equip dealers with real-time pricing and product details to confidently present options and close deals faster.
Enhance Dealer Satisfaction:
Deliver a user-friendly experience that aligns with dealer workflows, reducing friction and improving engagement.
Optimize for Field Use:
Ensure robust, responsive performance on iPads, even in challenging connectivity conditions.
Our Design Process / Approach
Crafting the Solution: The Blueprint for Success

Research & Strategy
We interviewed dealers to understand the optimal experience with essential features like configuration input, dynamic comparisons, and real-time pricing.

Ideation & Prototyping
Using design thinking, we developed clear, low-fidelity wireframes that focused on a touch-friendly comparison grid and intuitive user flows.

Testing & Iteration
Through iterative testing, we refined navigation, responsiveness, and user interactions—integrating features such as "Save & Share" and product highlights for instant updates.

Visual & Interaction Design
We finalized the design with high-quality visuals, consistent typography, and intuitive gestures to deliver a polished, engaging user experience.
Discovery and Research
Gathering Insights to Drive Innovation
We conducted extensive research—through interviews, surveys, and on-site observations—to understand the dealers' challenges in comparing product configurations and pricing. Key insights included:
Navigation Frustrations: Dealers struggled to quickly locate essential features within cluttered interfaces.
Input Complexity: The manual process involved too many fields at once, overwhelming users and increasing the risk of errors.
Field Limitations: The tool needed to perform reliably on iPads in varying connectivity conditions, ensuring real-time updates during customer interactions.
This research informed our strategic focus on clarity, and real-time functionality to meet the fast-paced needs of field sales.
User Personas
Understanding Our Sales Force
The Sales Person
A seasoned sales professional who thrives on fast-paced, on-site interactions.
Goals
Quickly compare products and provide accurate, real-time pricing to customers.
Pain Points
Frustration with slow, manual processes and outdated comparison methods.
Needs
A simplified interface with filters and high-quality images.
The Repeat Order Specialist
Manages recurring orders for small to medium businesses, valuing efficiency and accuracy.
Goals
Simplify bulk comparisons and maintain an accessible order history for repeat transactions.
Pain Points
Time wasted on repetitive data entry and navigating cumbersome interfaces.
Needs
An efficient, bulk-comparison feature with saved order histories and easy reordering options.
The Tech-Savvy Consultant
Uses advanced digital tools to provide detailed product insights in real time.
Goals
Deliver comprehensive product data to enhance customer confidence during sales pitches.
Pain Points
Inconsistent, outdated product information and a lack of intuitive, data-rich tools.
Needs
A dynamic, feature-rich tool with clear product highlights, real-time updates, and intuitive interactions.
Competitive Analysis
Based on real market research, we evaluated leading competitors to identify gaps and opportunities:
Platform
Strengths
Weaknesses
Budget Blinds
Robust digital platform with real-time data updates.
Complex navigation; not optimized for mobile devices.
Compare Pro
User-friendly interface with strong mobile capabilities.
Limited product configuration options; lacks comprehensive comparison features.
Quick Quote
Detailed product comparisons with instant pricing.
Overwhelming data presentation; steep learning curve for new users.
Price Out
Speedy, one-click ordering process.
Limited customization for field-specific needs and offline functionality.
SWOT Analysis
Strengths: Tablet-first design, real-time price updates, offline functionality, and intuitive comparisons.
Weaknesses: Initial dealer training and potential Wi-Fi dependency in some environments.
Opportunities: Integration with dealer systems and expansion to additional product categories.
Threats: Competitors enhancing their mobile offerings and dealer reluctance to change legacy processes.
Ideation and Brainstorming
Unveiling the Core Challenges
The Proposed Solution
01
Quick Compare & Custom Compare Modes
Allowing dealers to either rapidly compare standard configurations or tailor comparisons to specific customer needs.
02
Real-Time Price Updates
Ensuring that any change in product configuration automatically adjusts pricing.
03
Seamless Sharing
Enabling dealers to easily save, share, or export comparisons to enhance customer communication.
Wireframing, Prototyping and Testing
Turning Ideas into Reality
We created interactive prototypes in three phases—low, mid, and high fidelity—to refine navigation, input processes, and product comparisons. Each iteration incorporated dealer feedback, enhancing usability, responsiveness, and visual clarity.
Wireframing
Early wireframes allowed us to outline key user flows and interface structures for product selection, configuration input, and comparisons. This process validated our design assumptions and set the foundation for developing refined, high-fidelity prototypes.

Usability Testing
From Insights to Refinement
5
Testing rounds with users
50+
Overall participants
Round 1: Usability
Low-Fidelity Prototypes
In our initial prototyping phase, we tested low-fidelity prototypes with a group of 12 sales people to validate our early design concepts.
12
Sales People
Feedback Highlights:
Navigation Issues:
Feedback: Dealers found the initial navigation unintuitive, struggling to locate key features such as product input and comparison grids.
Refinement: We introduced a prominent navigation bar with clearly labeled tabs—“Input Measurements,” “Compare Products,” and “View Prices.”
Complexity in Inputs:
Feedback: The configuration input form appeared overwhelming due to too many visible fields at once.
Refinement: A step-by-step input process with progressive disclosure was implemented, showing only the relevant fields at each stage.
Visual Overload:
Feedback: The comparison grid contained too much information, making it difficult to scan quickly.
Refinement: We simplified the grid to display only essential details (e.g., dimensions, price, and key features) and added expandable sections for additional information.
Round 2 Usability Testing
Mid-Fidelity Interactive Prototypes
After the first round of testing, we went in and incorporated some more elements to make the prototypes more interactive, and in a mid-fidelity format. Next, 15 dealers tested these mid-fidelity prototypes, allowing us to refine interactions and visual elements.
15
Sales People
Feedback Highlights:
Field Responsiveness:
Feedback: Dealers reported occasional lag when entering measurements or switching comparisons, especially in areas with weak Wi-Fi.
Refinement: We optimized the code for faster load times and incorporated offline functionality for data entry without an active connection.
Touch Controls:
Feedback: Swiping gestures were not consistently recognized on iPads, and some buttons were too small for comfortable touch input.
Refinement: Touch target sizes were increased, and gesture smoothing was implemented for reliable responsiveness.
Aesthetic Preferences:
Feedback: Dealers expressed a preference for larger product images to better visualize options alongside specifications.
Refinement: Image sizes in the grid were increased, and a zoom function was added for detailed views.
Round 3 Usability Testing
High-Fidelity Prototype Testing
After incorporating feedbacks and refining the prototypes, we worked further on it to bring it to a high-fidelity format. Finally, 20 dealers evaluated the high-fidelity prototypes in real-world scenarios, which helped us perfect the tool.
20
Sales People
Feedback Highlights:
Real-Time Updates:
Feedback: Dealers loved the immediate pricing updates when modifying configurations but noted slight delays in some calculations.
Refinement: Back-end processes were enhanced to ensure instantaneous updates across all fields.
Comparison Usability:
Feedback: While the side-by-side comparison grid was well received, dealers requested the ability to save and share comparisons.
Refinement: We added a “Save & Share” button, enabling dealers to email or download a PDF of comparisons for customer review.
Sales Confidence:
Feedback: With 90% of participants reporting increased confidence in sales conversations, a suggestion emerged to include a “key benefits” summary for each product.
Refinement: A product highlights section was introduced, summarizing unique features in a visually distinct area of the grid.
A High-Level Walkthrough of Some Final Prototype Screens
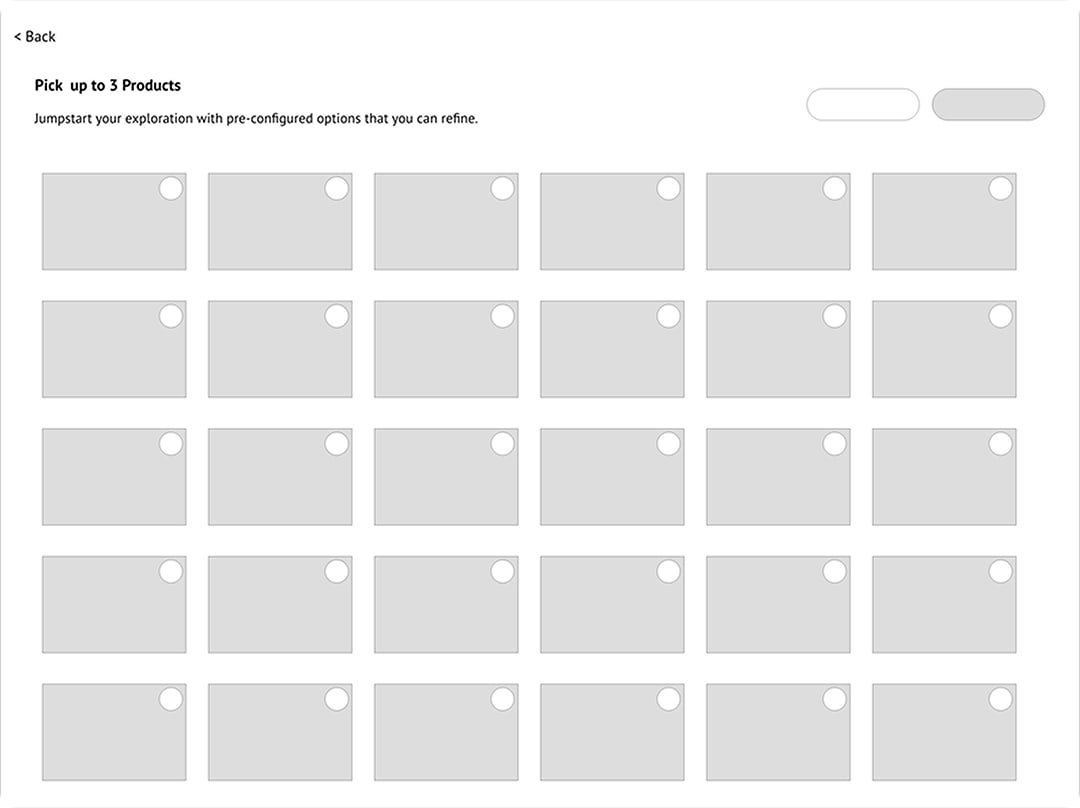
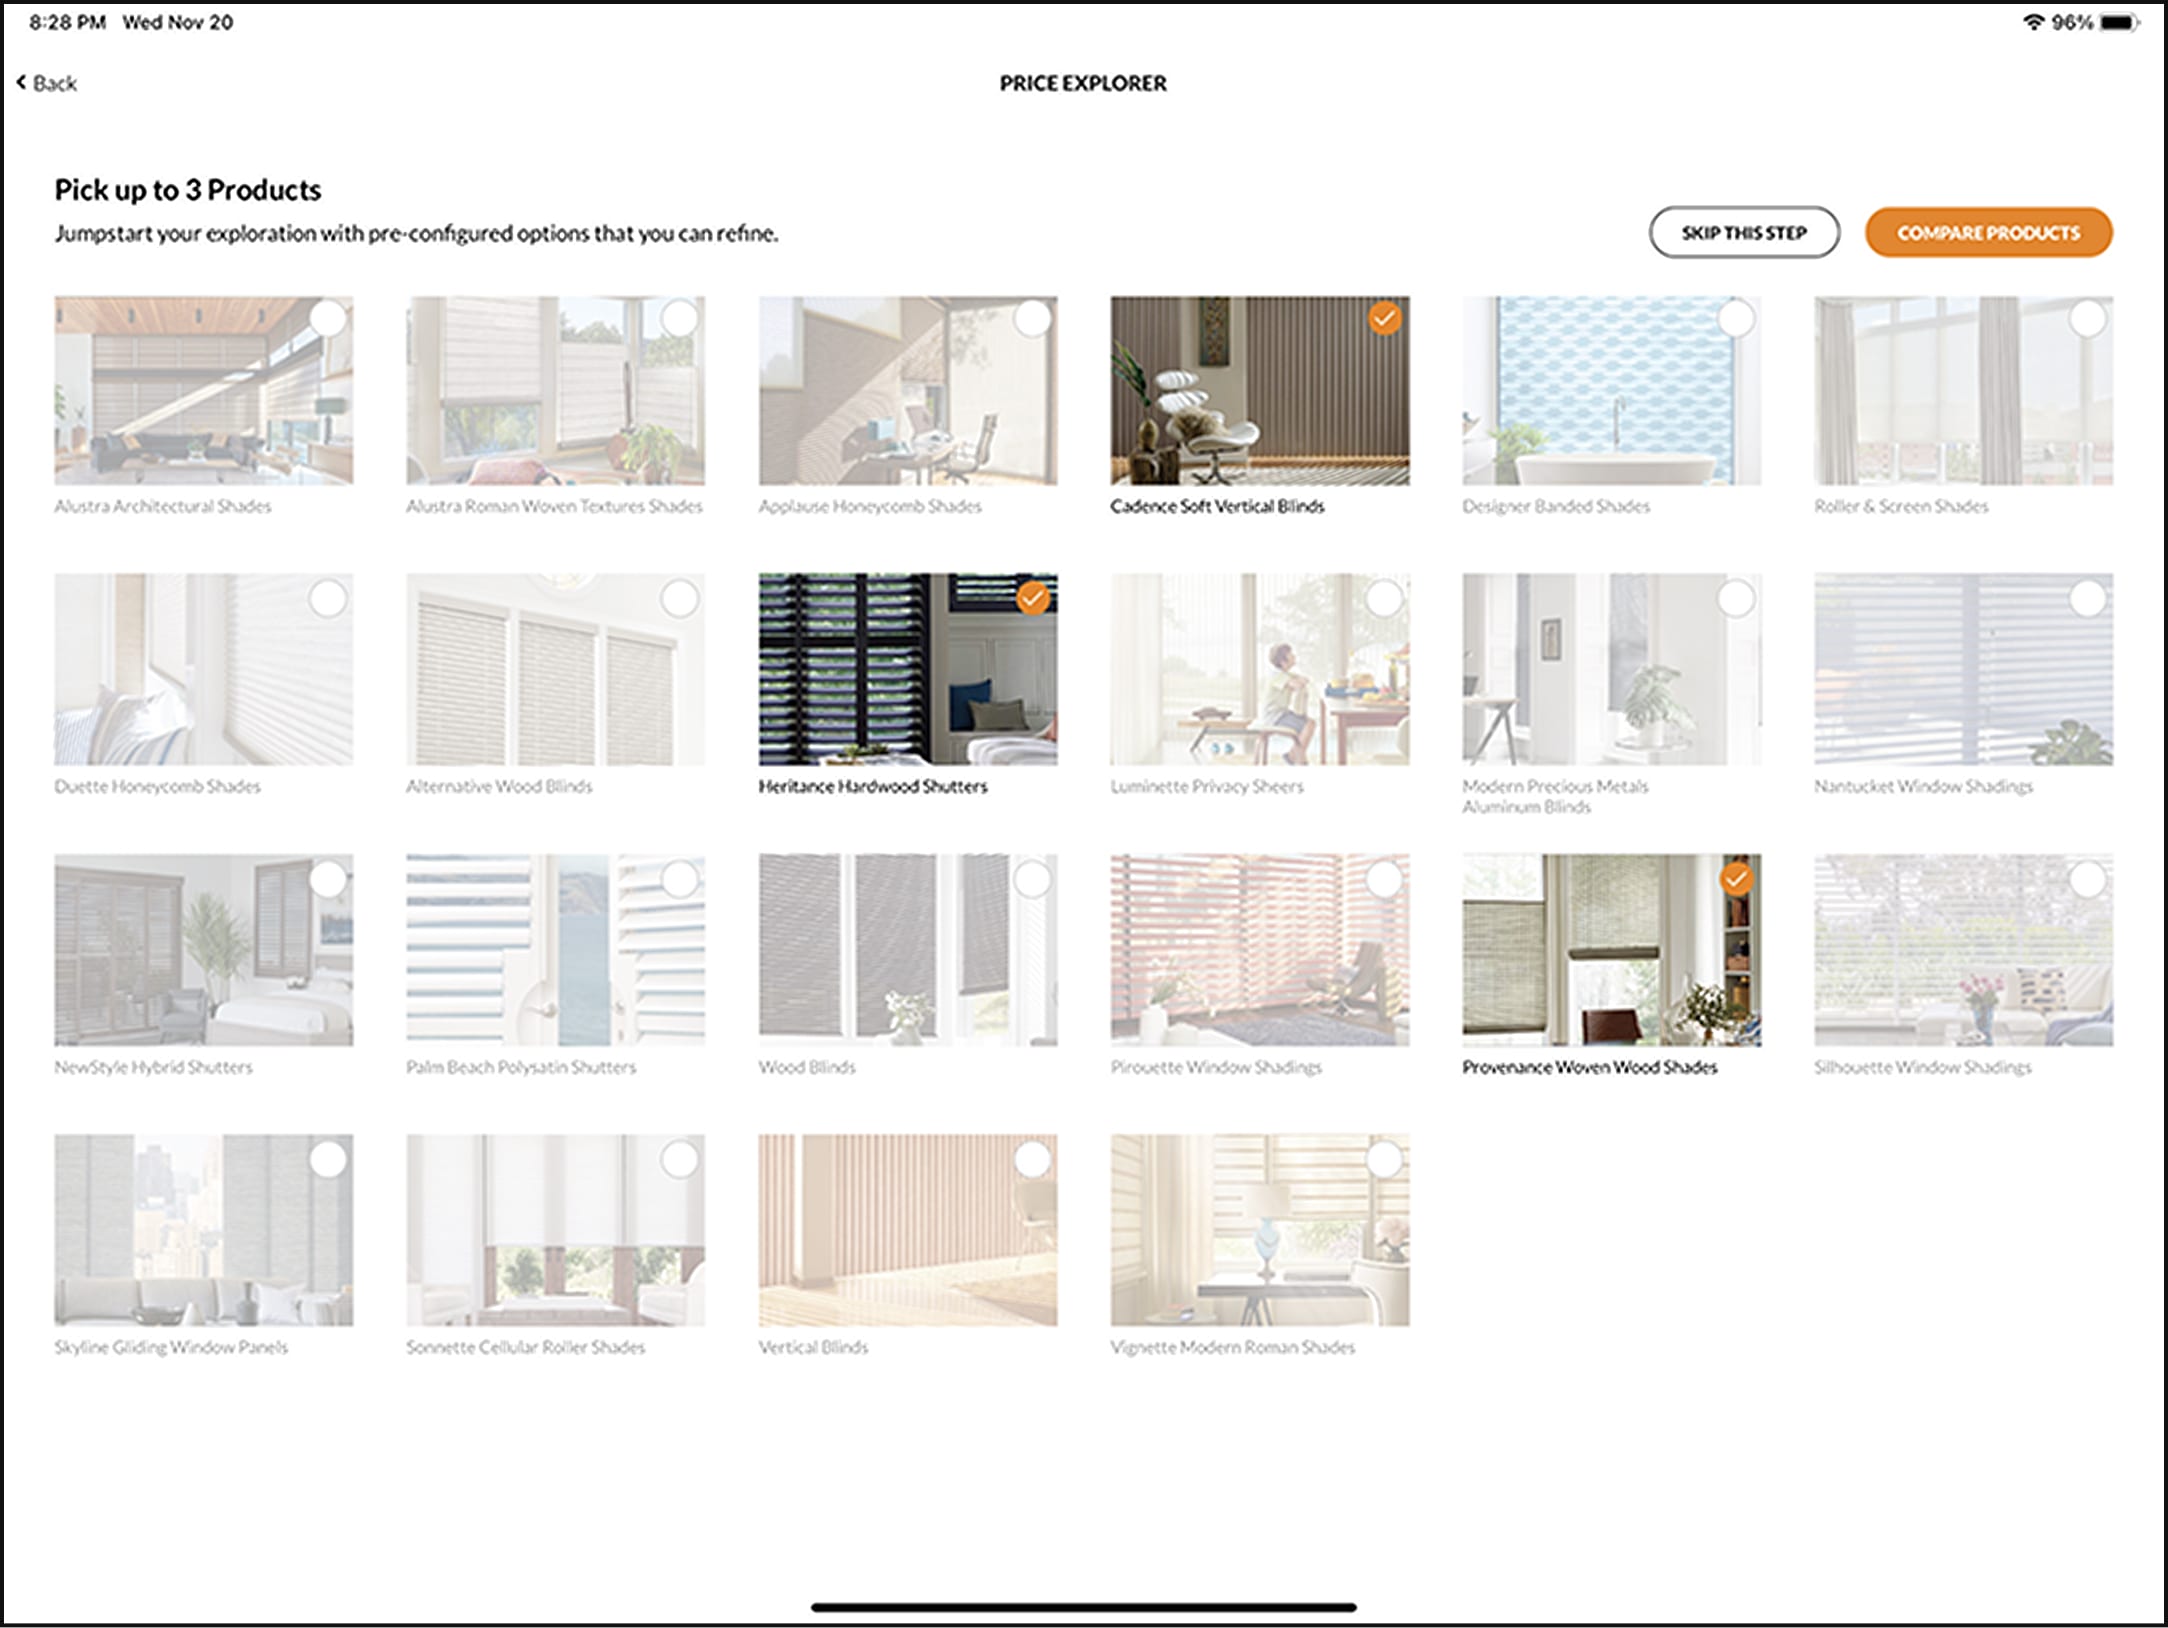
Users have the options, quick compare and custom compare.
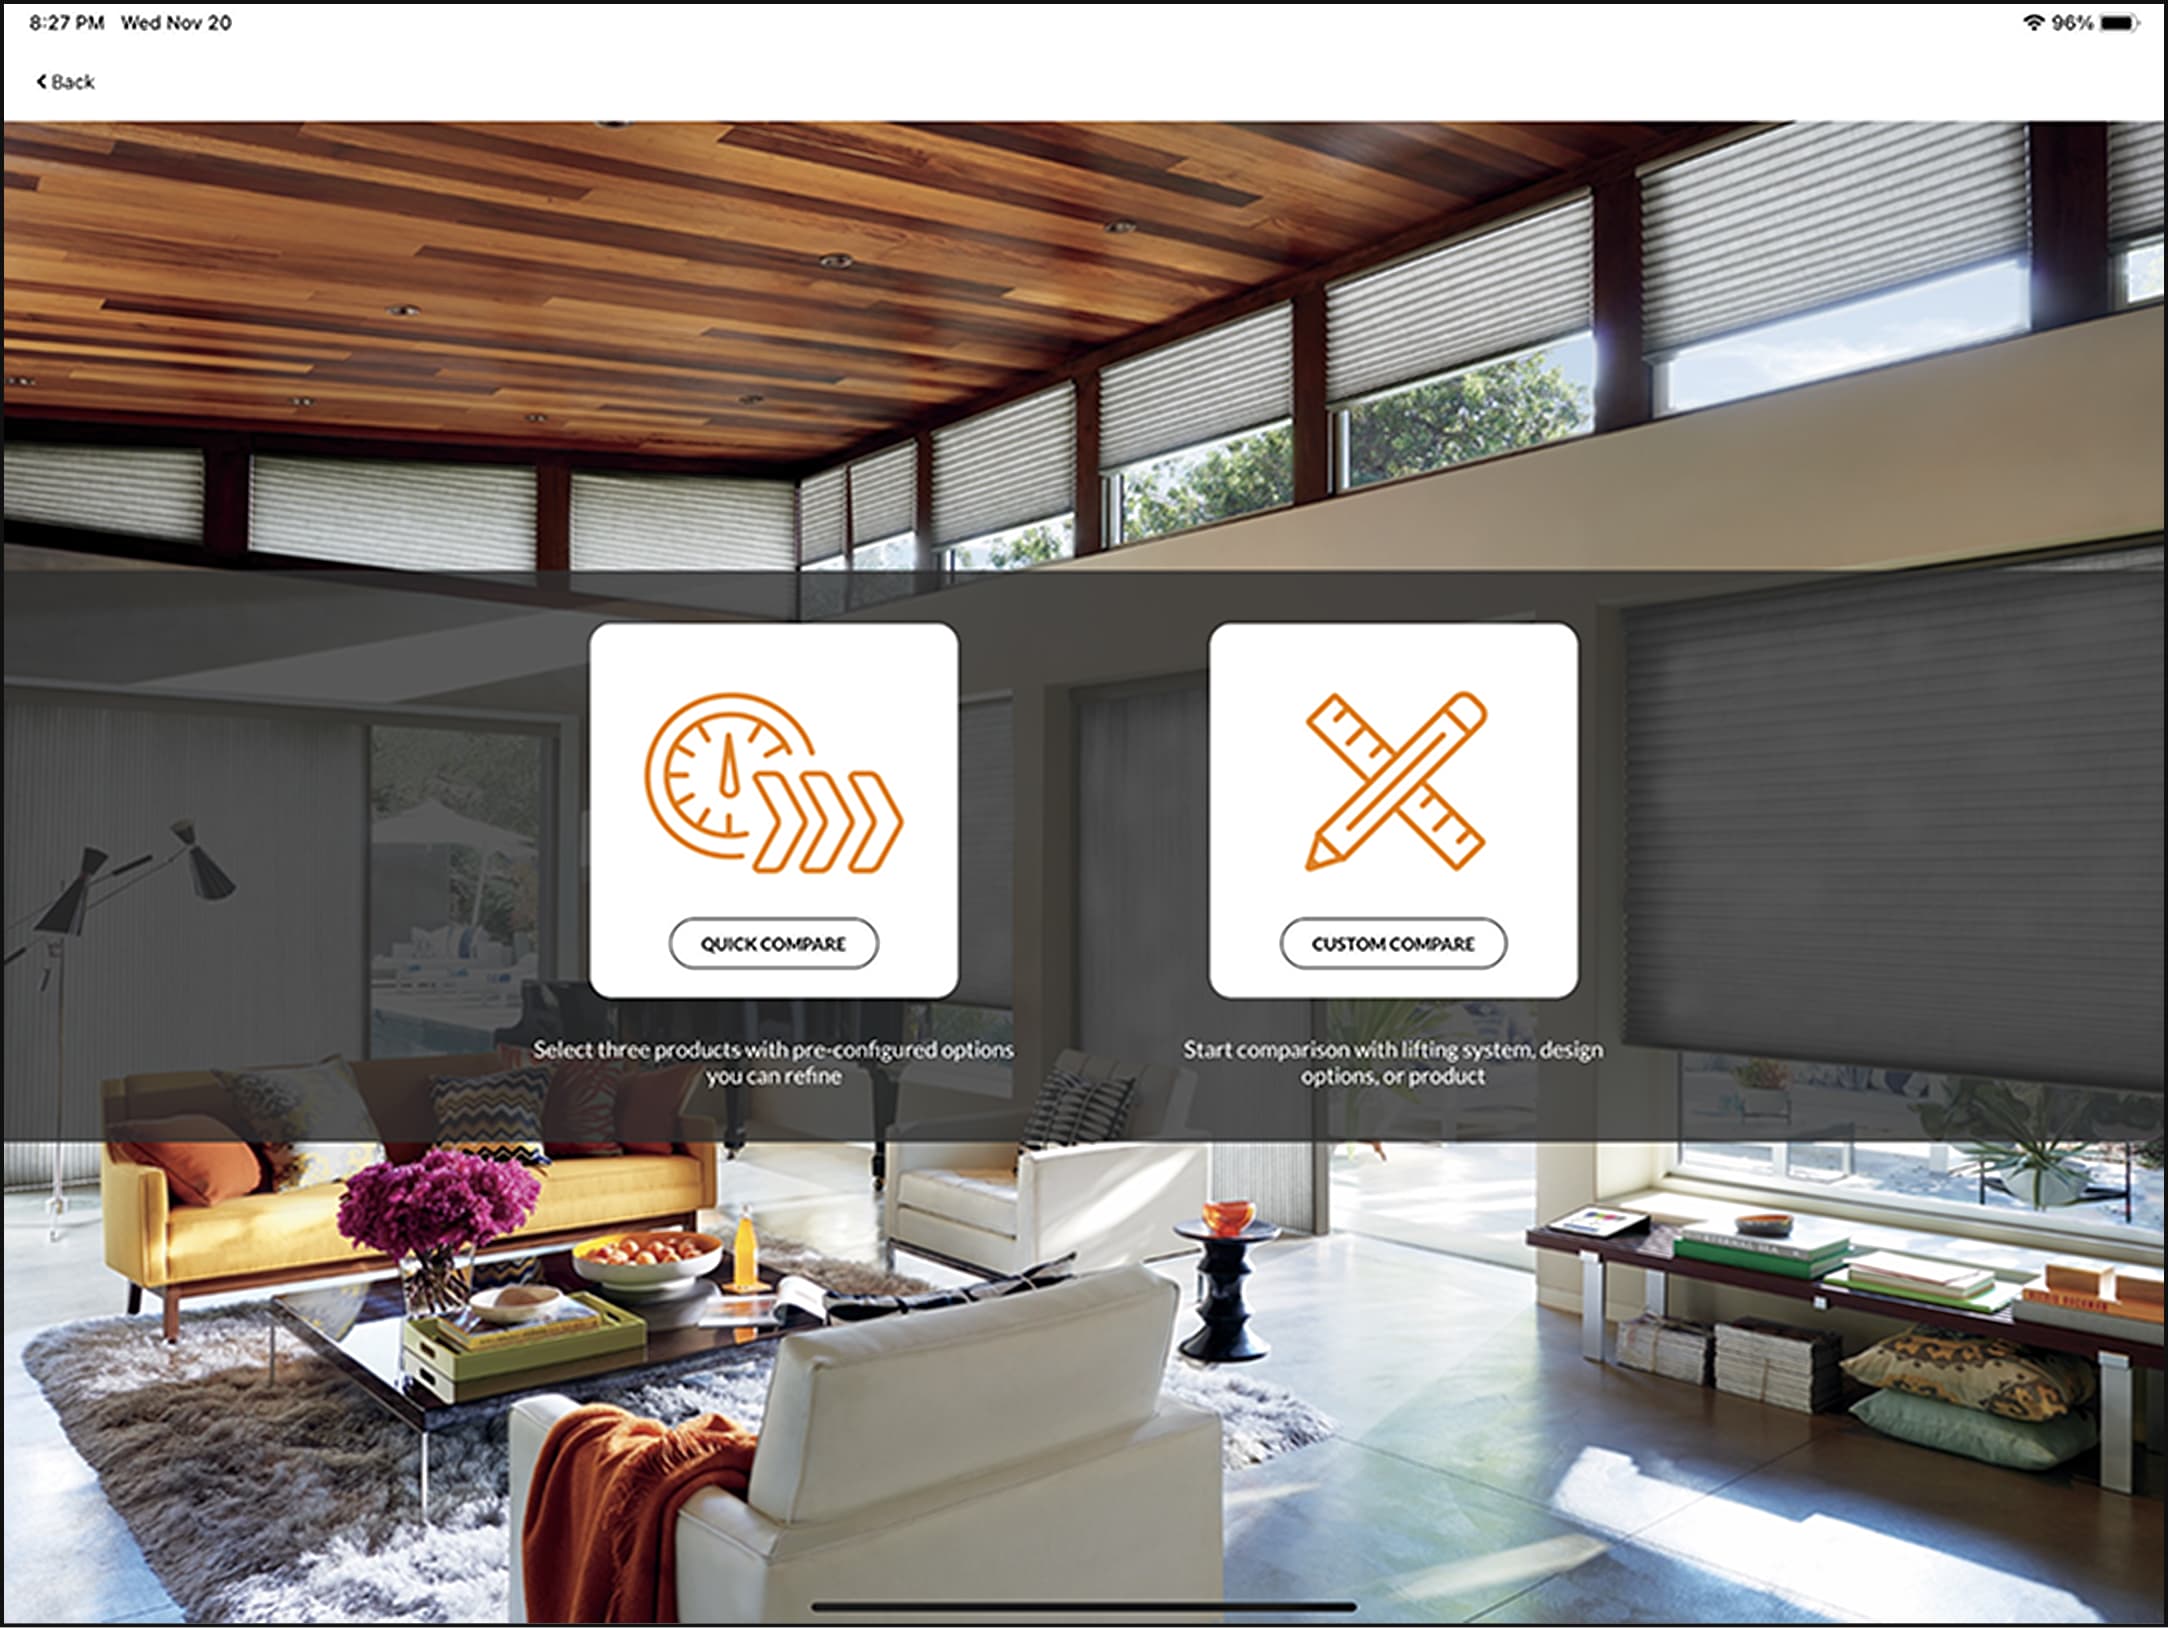
We'll start with quick compare. A user will start by selecting up to 3 products.
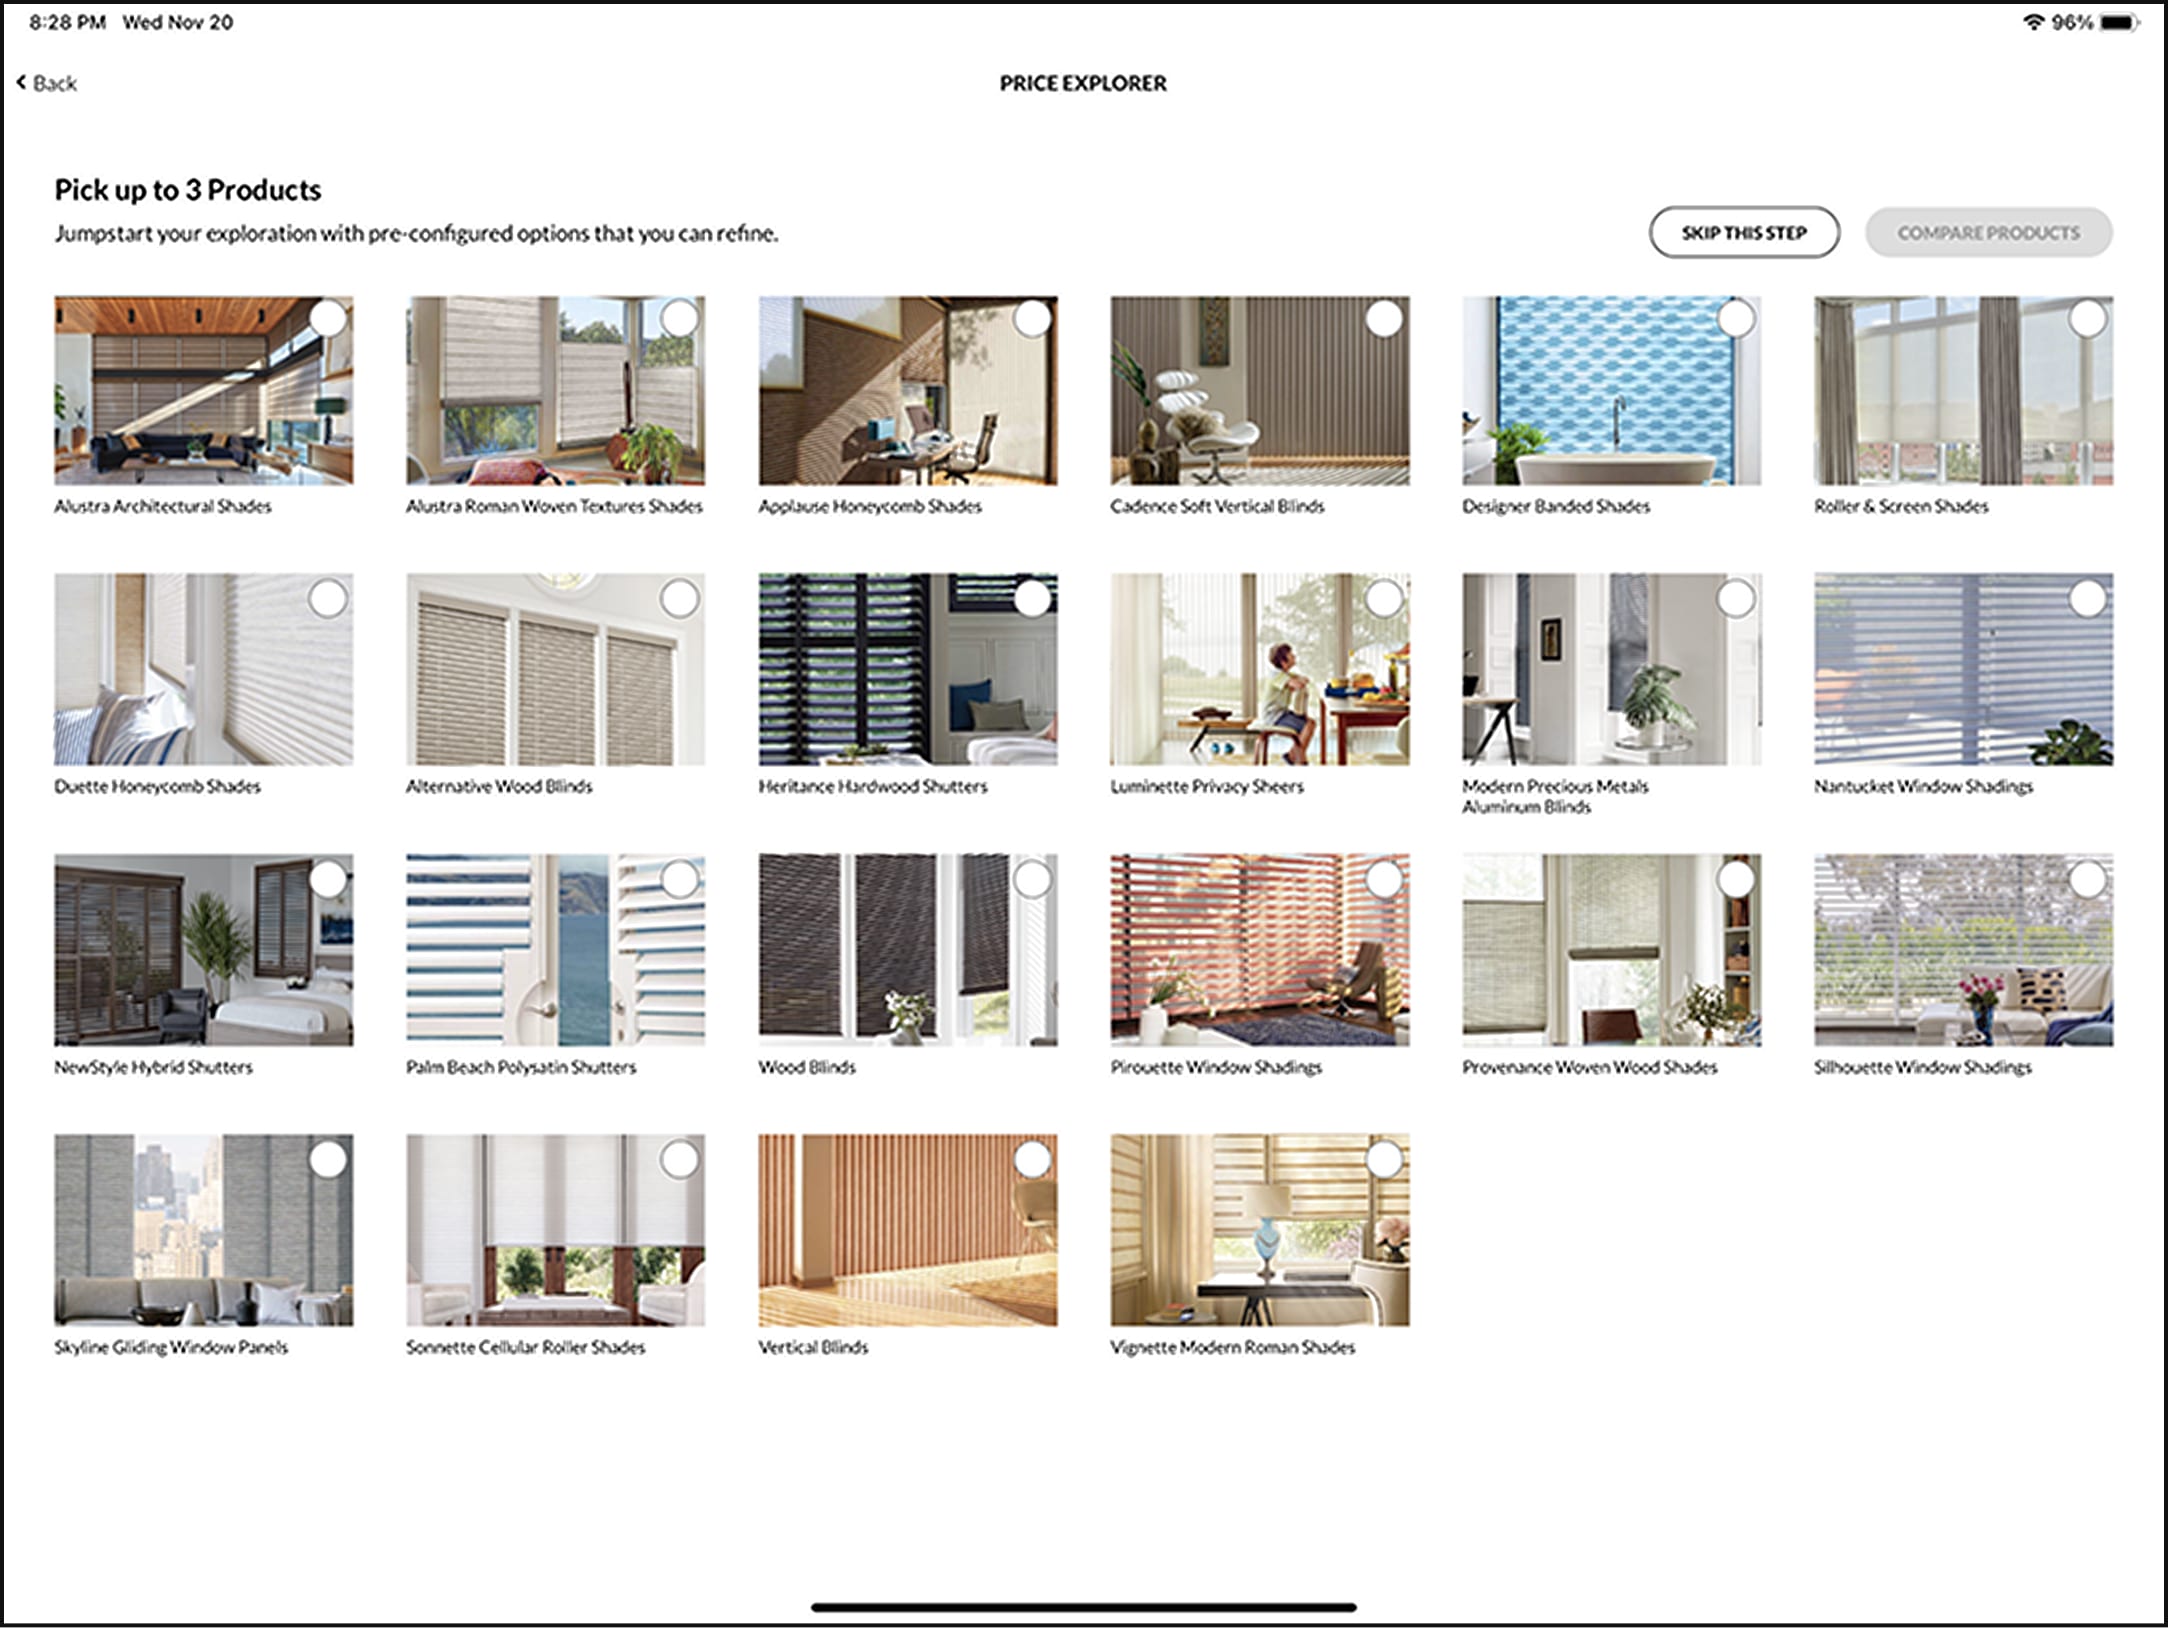
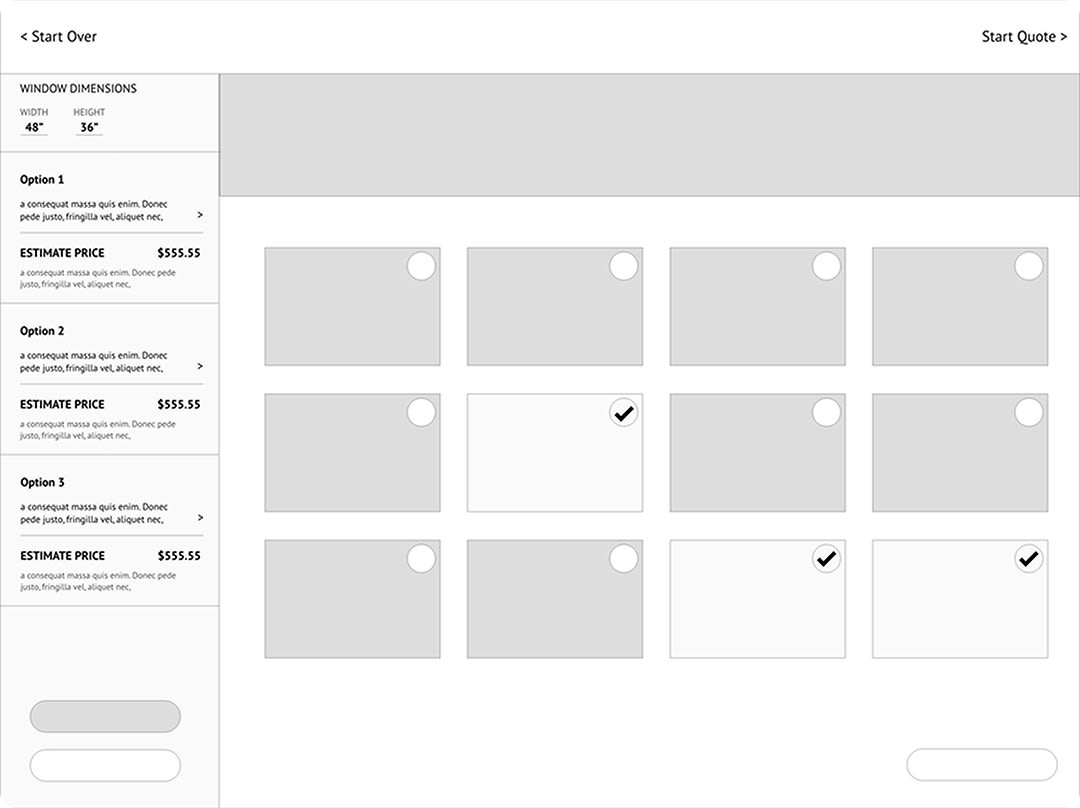
Once 3 products are selected you will then click compare products.
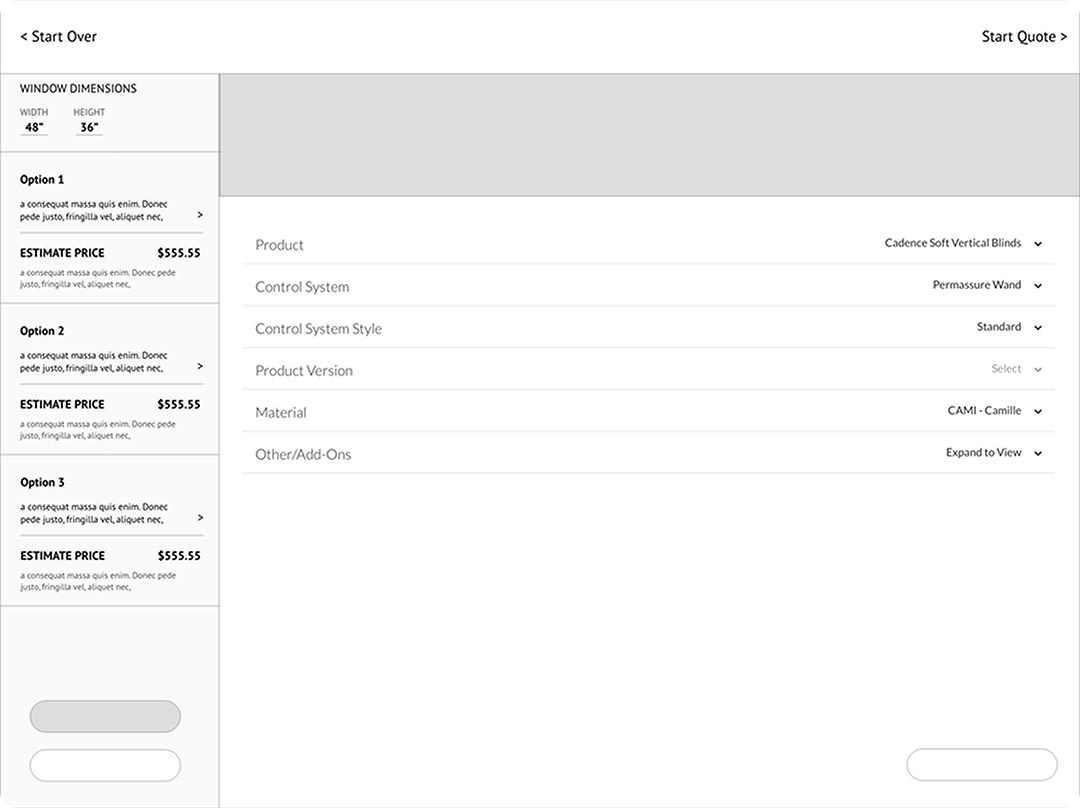
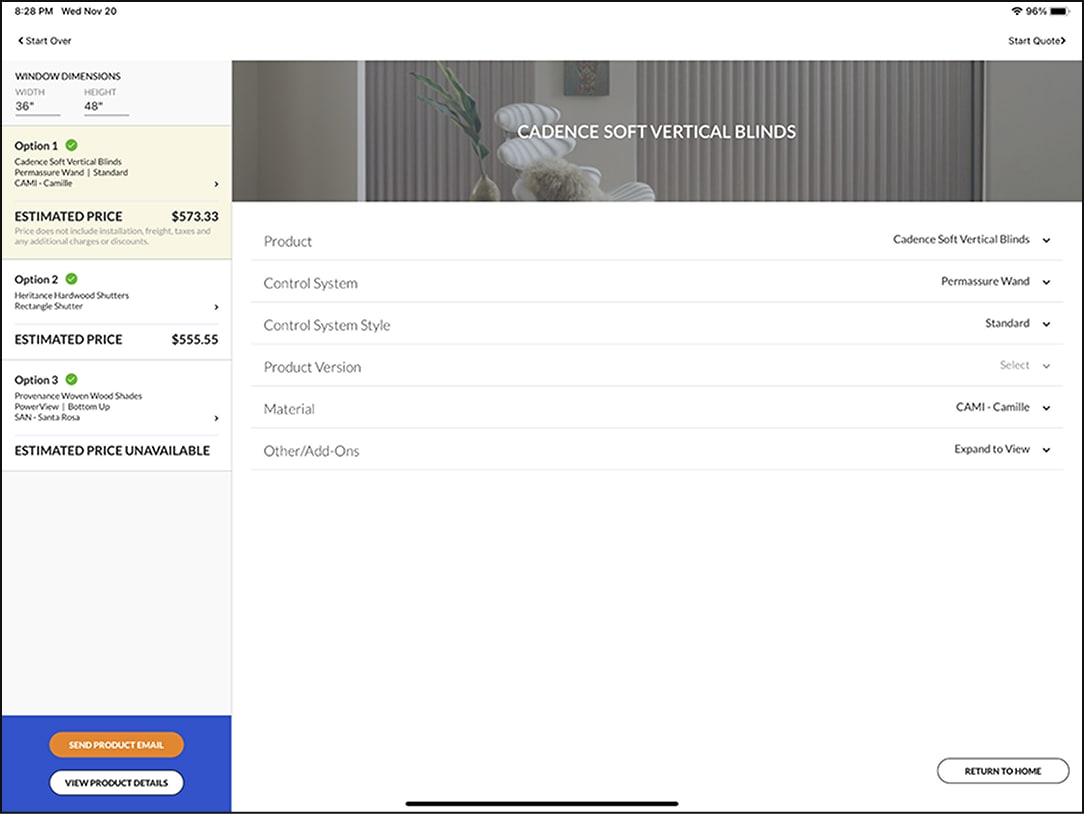
The user will then be presented with prices based on generic configurations.
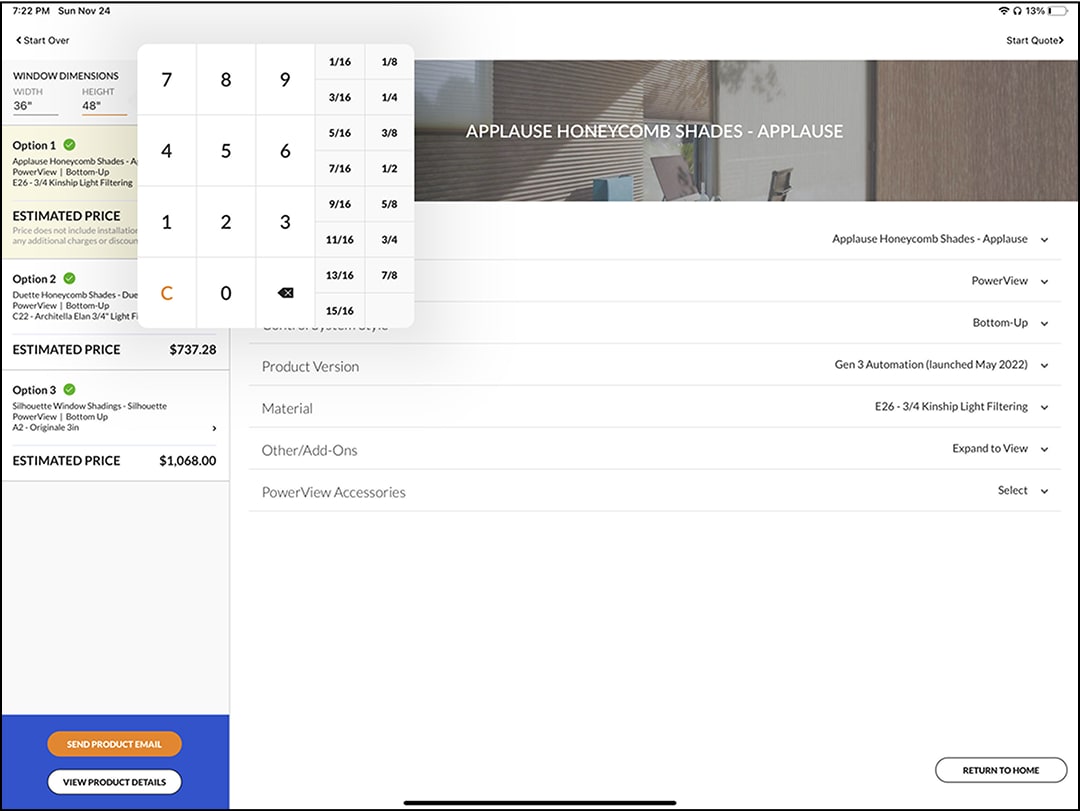
You can modify the measurements by clicking on width or height.
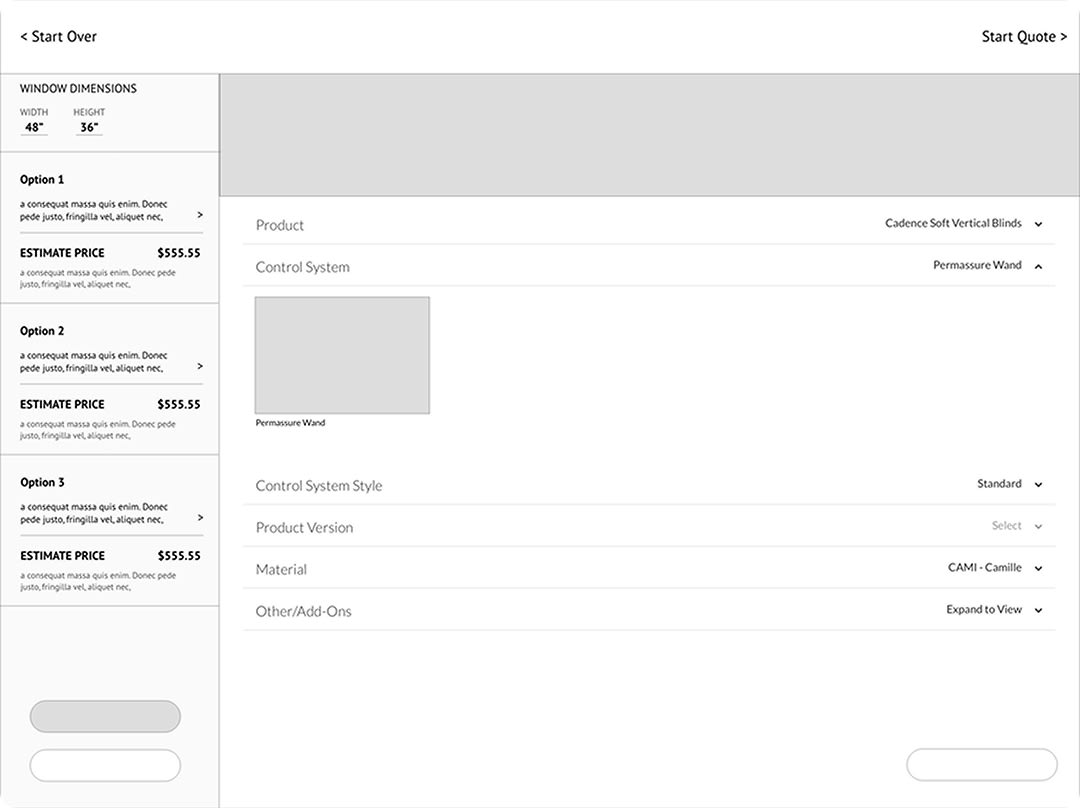
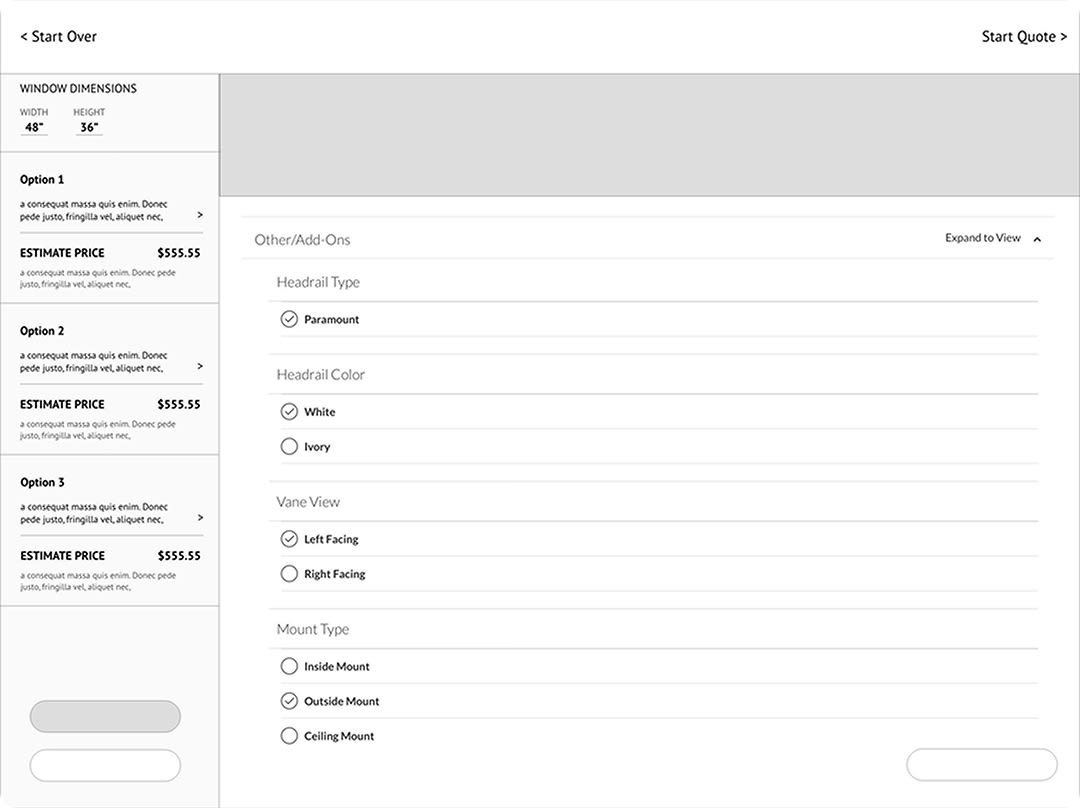
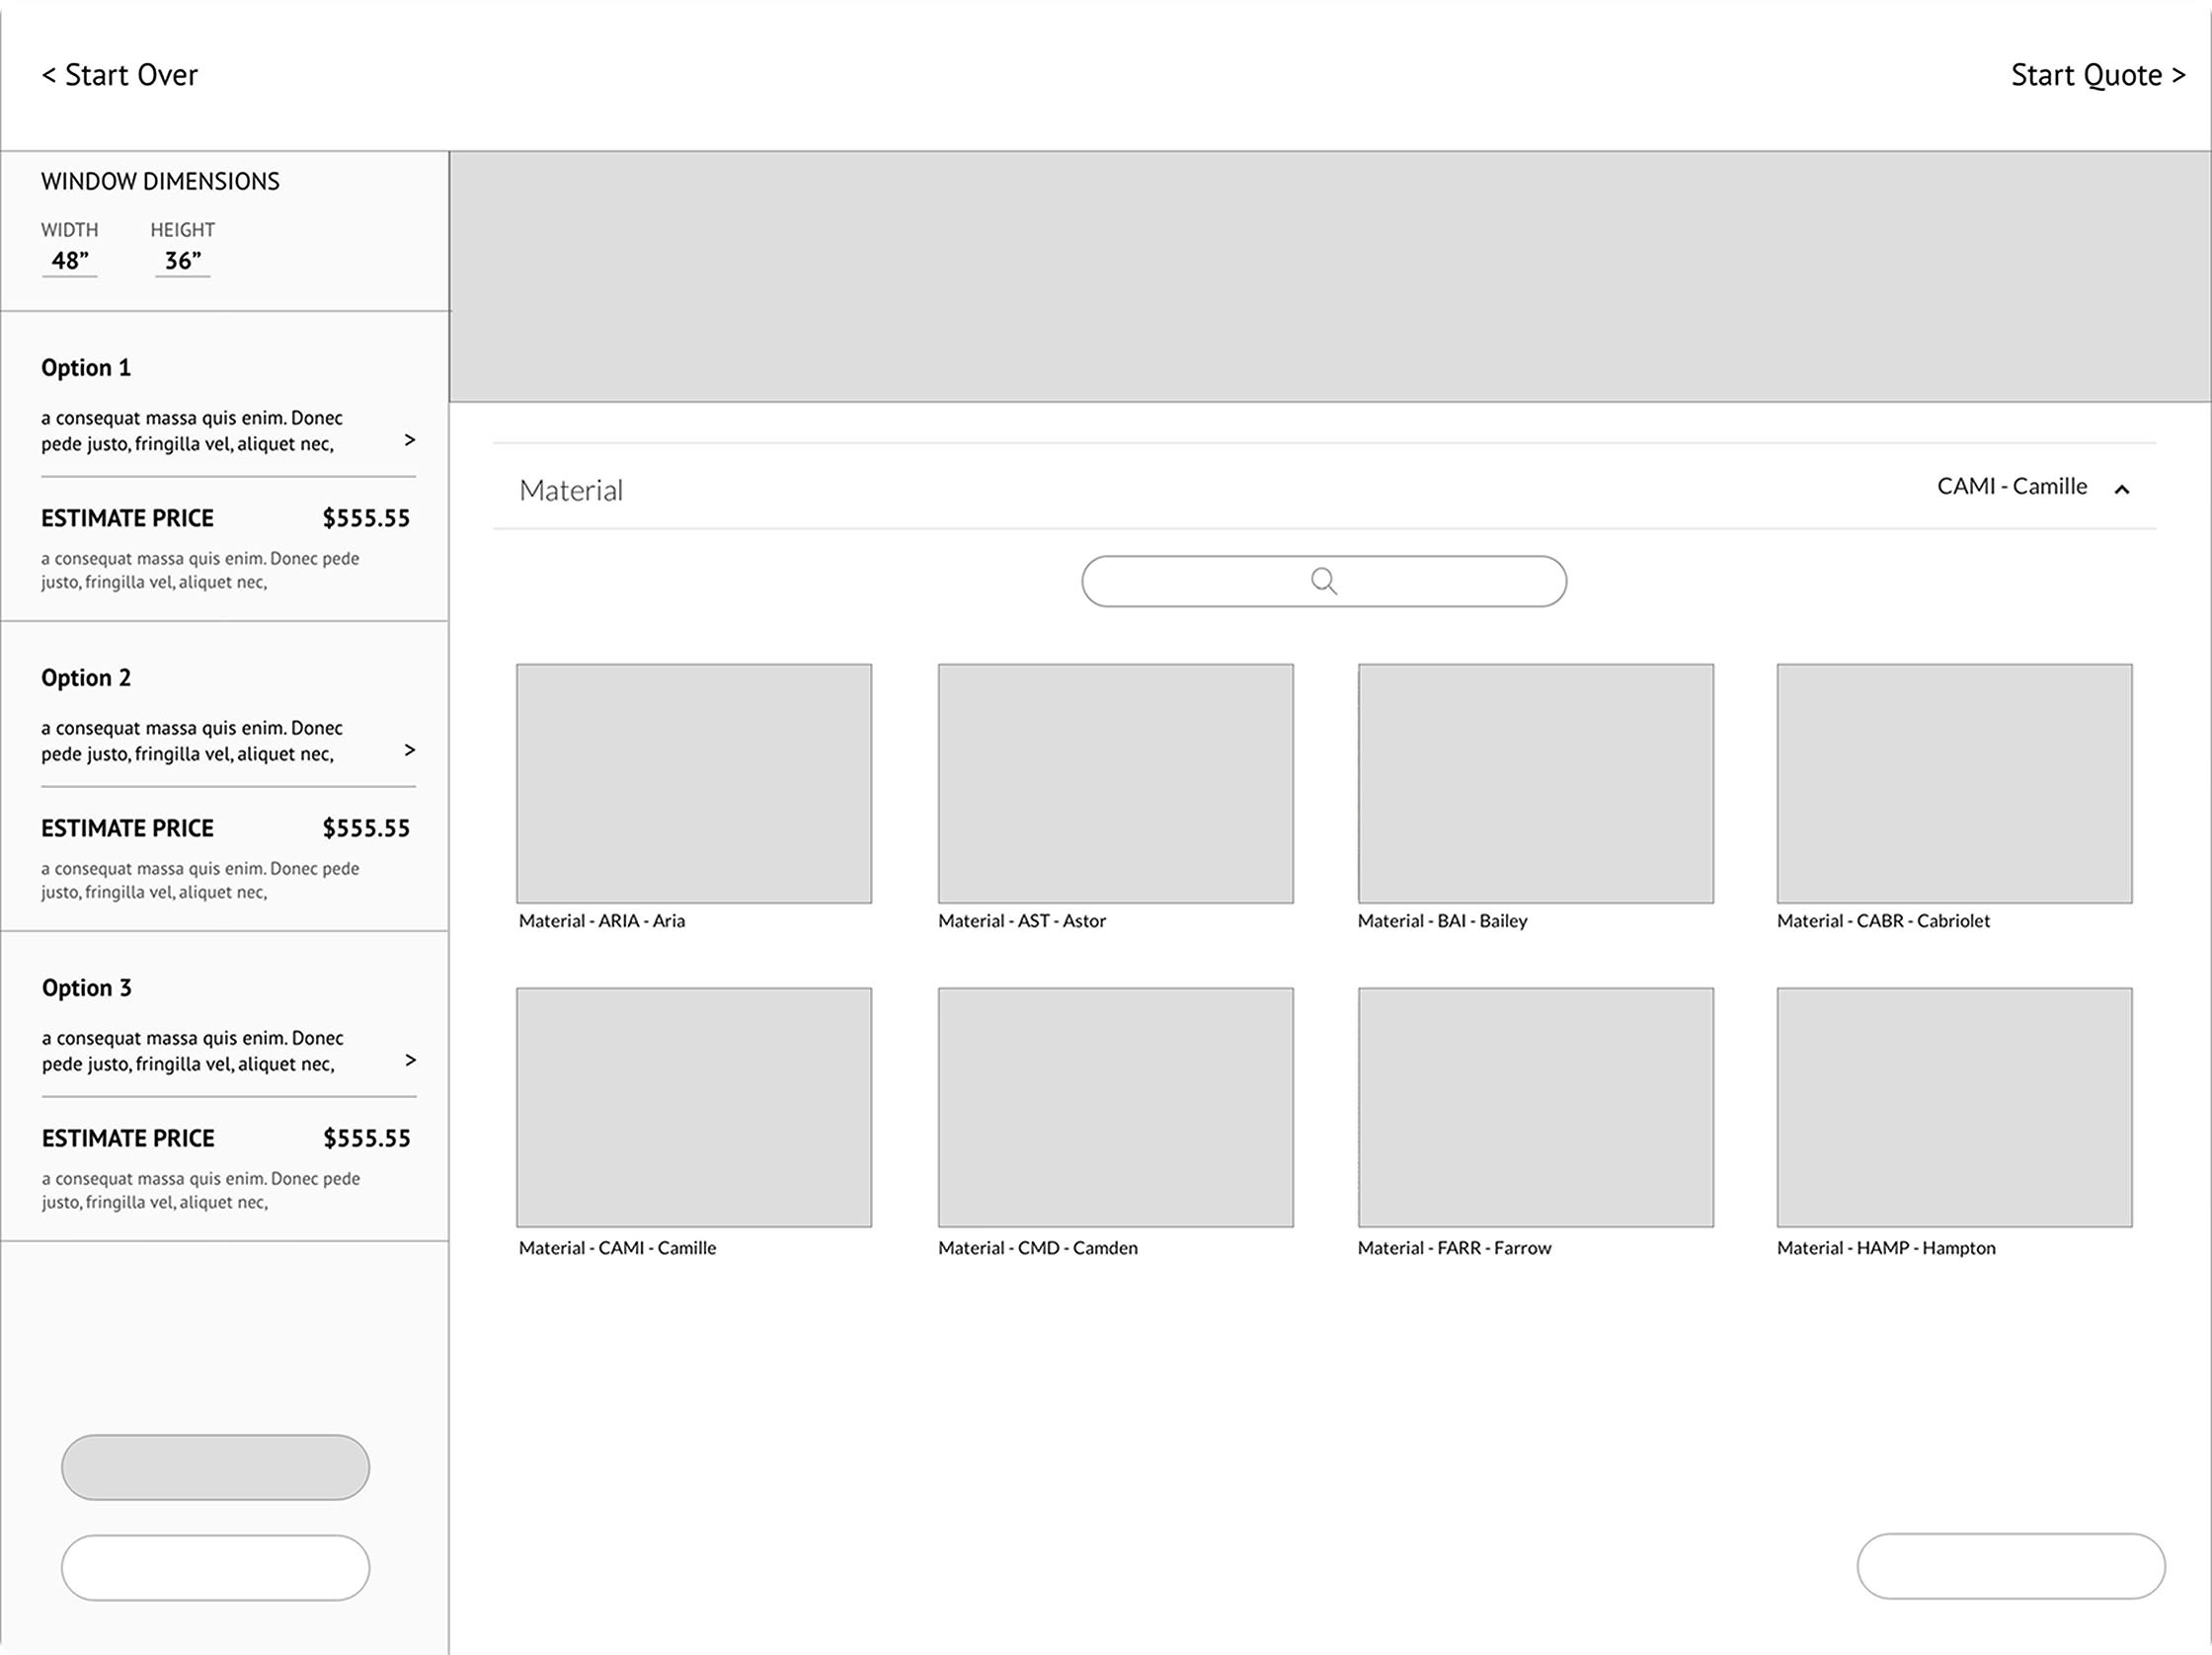
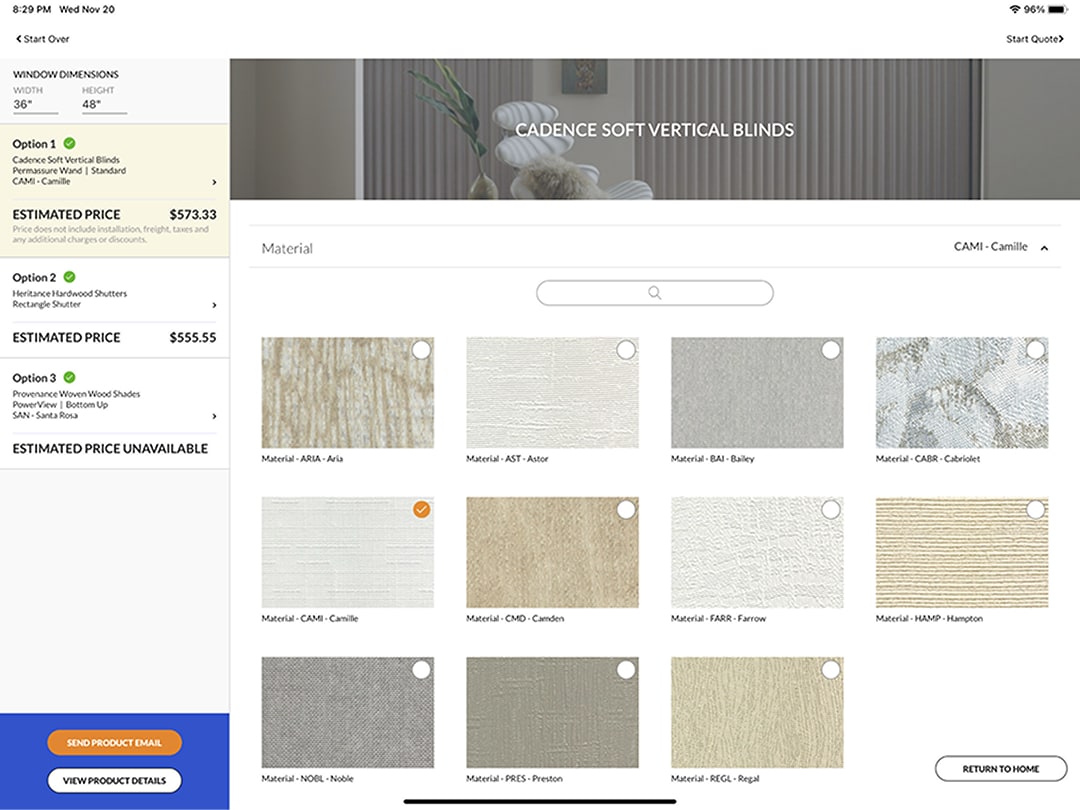
You have an expandable list view to make modifications to each configuration.
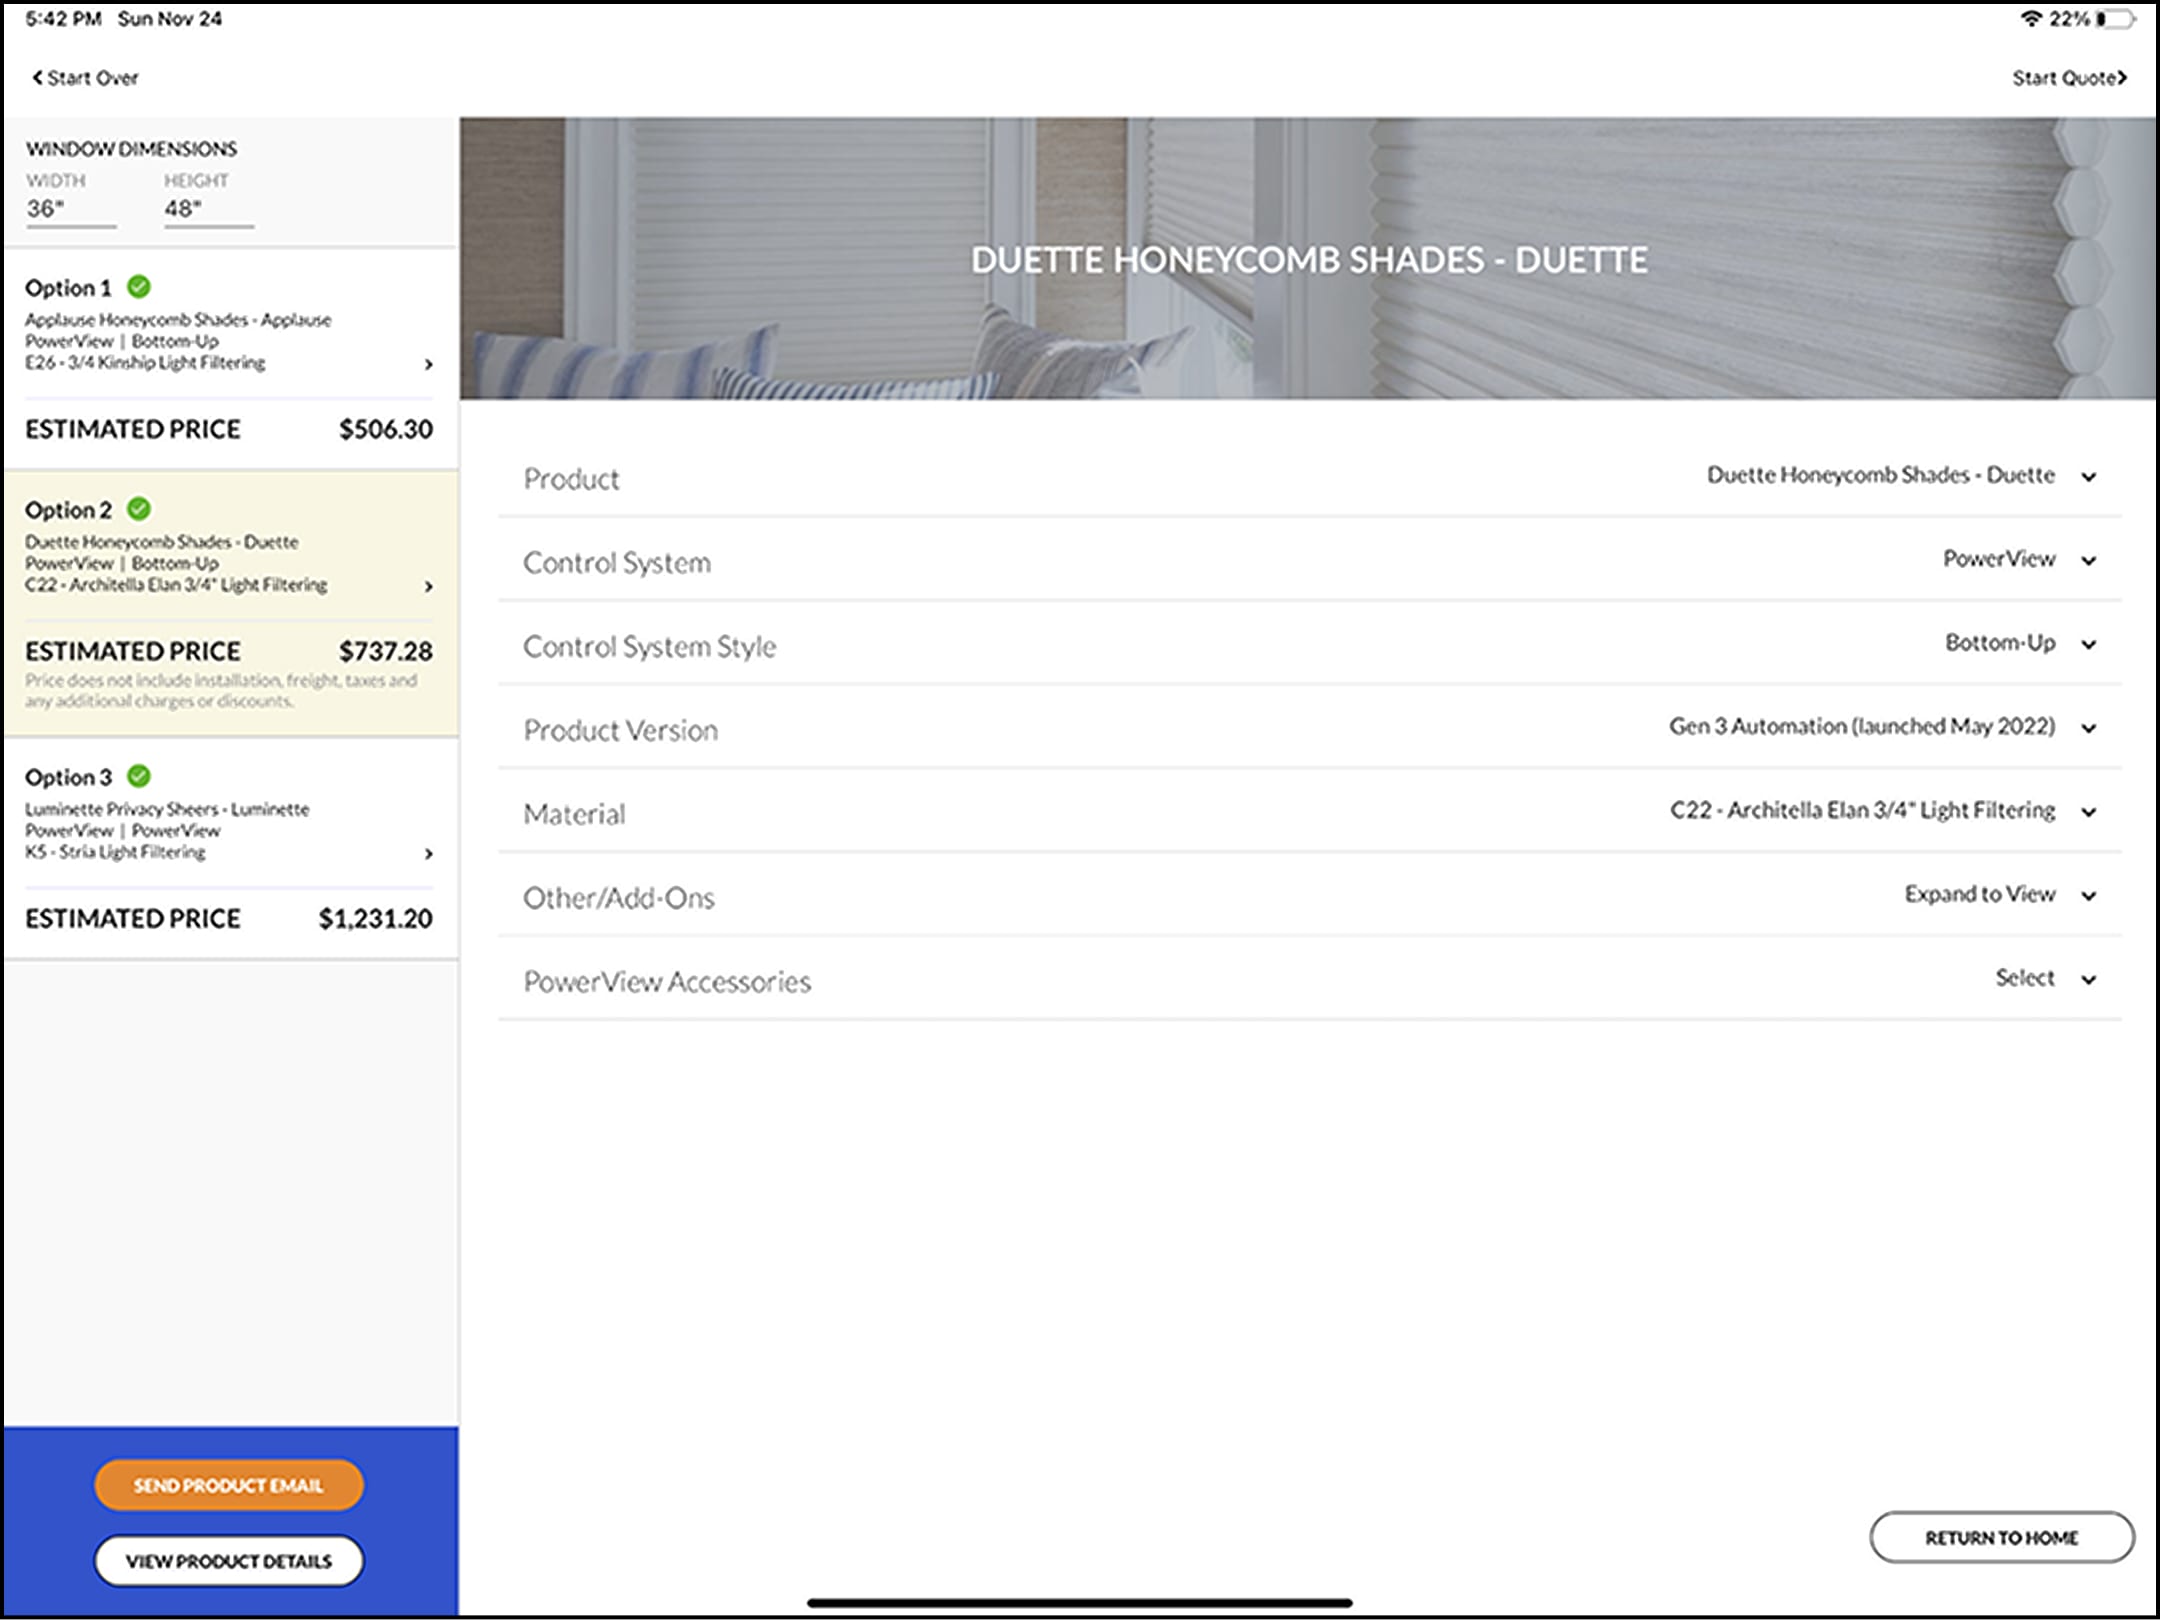
You can modify any of the options and price will automatically update.
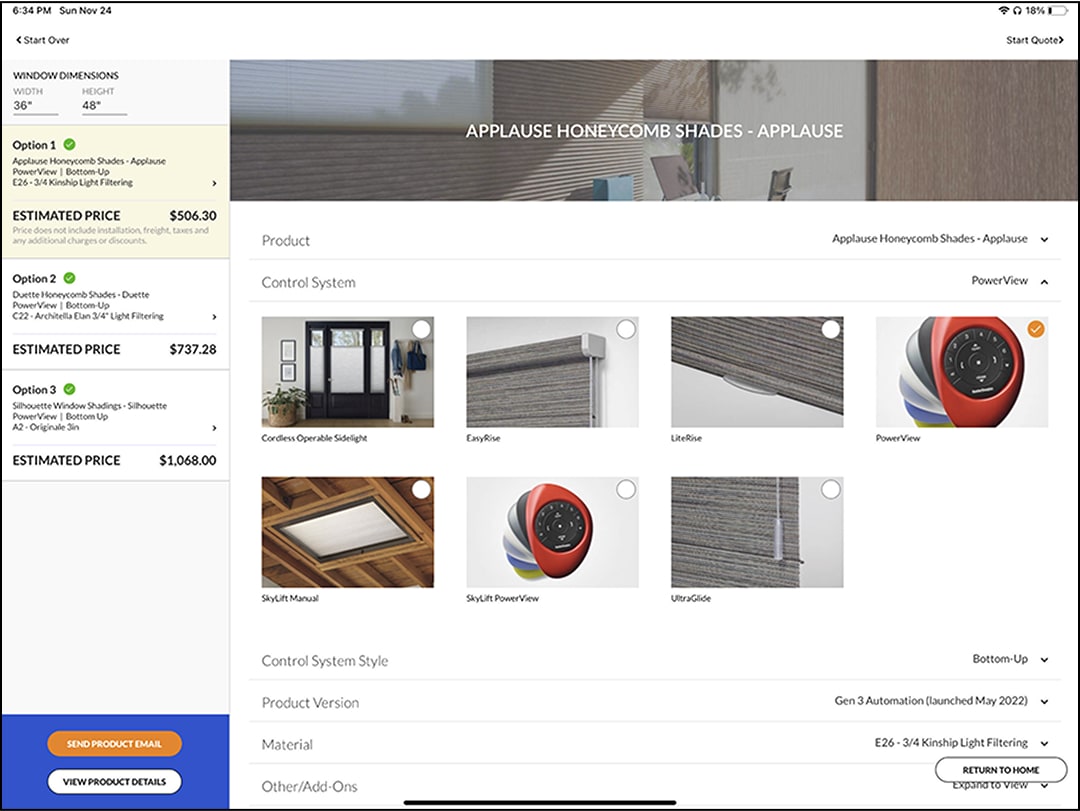
The selectors will automatically filter out offerings that aren't compatible.
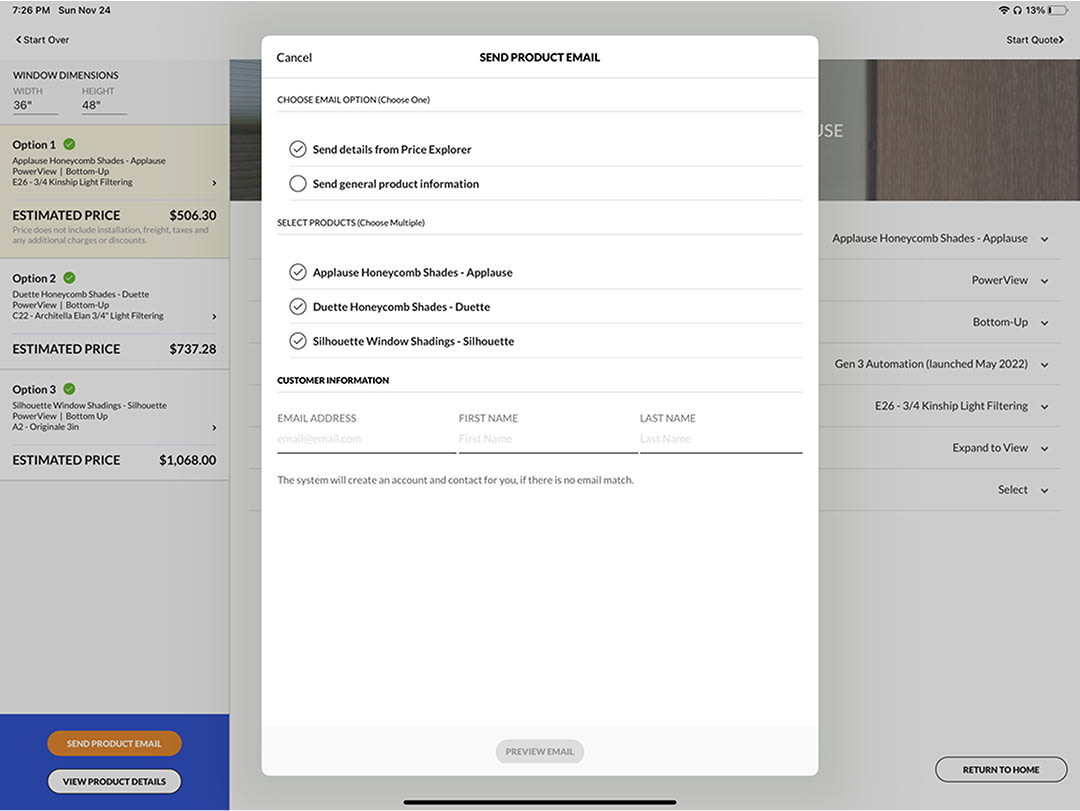
You have the option to send a comparison email to the client.
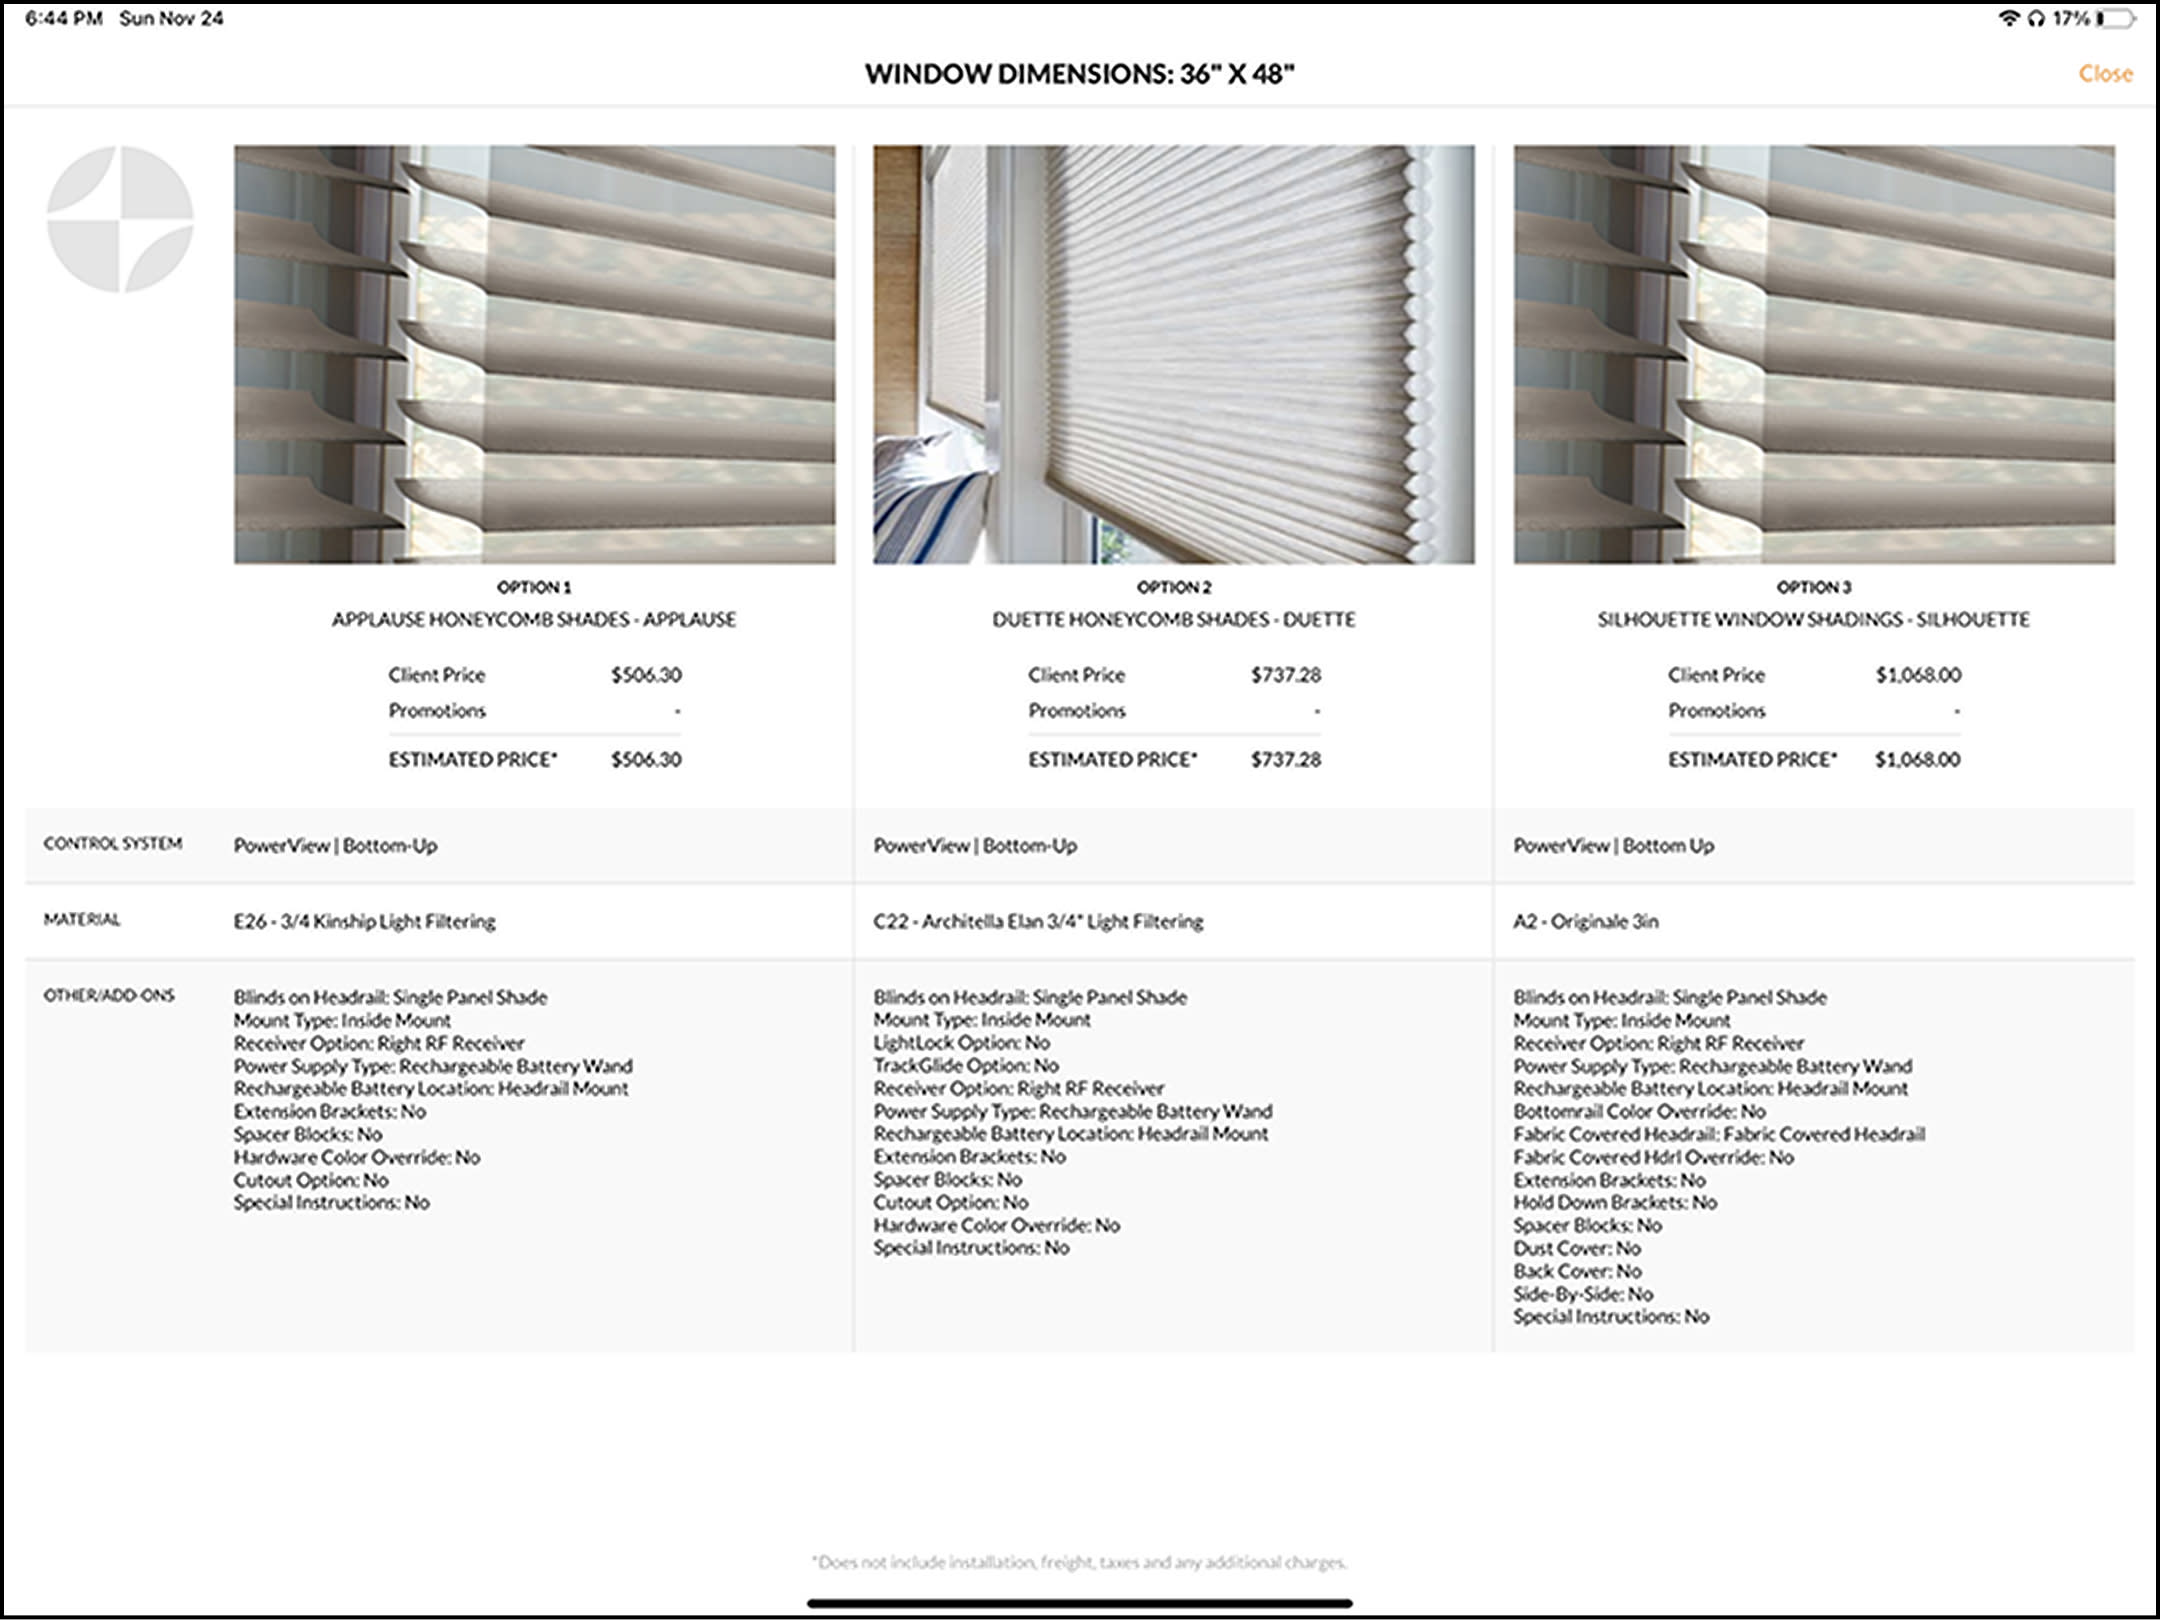
Additionally, the user can show the customer a breakout of each product and price.
Post-Testing Metrics
Tangible Improvements in Efficiency and Satisfaction
The impact of the redesigned digital parts ordering platform was measured across several key performance indicators, demonstrating significant improvements in usability, efficiency, and user satisfaction:
Usability Rating
Dealers reduced time spent comparing products by 40%, freeing up more time for customer engagement.
Configuration Speed
Mobile satisfaction scores improved significantly, rising from 6.8 to 9.0/10. Enhanced mobile responsiveness, optimized layouts, and larger touch targets contributed to a more user-friendly experience, particularly for Installers accessing the platform in the field.
Adoption Rate
Over 85% of pilot dealers integrated the Price Explorer into their daily workflows within the first month.
Sales Conversions
The pilot program resulted in a 12% increase in sales conversions, contributing to an overall sales boost of 5.3%.